Librotech Inspection (2023)
Cross-platform application for analyzing records collected by the data logger
Source code: https://github.com/andude10/Librotech-Inspection.
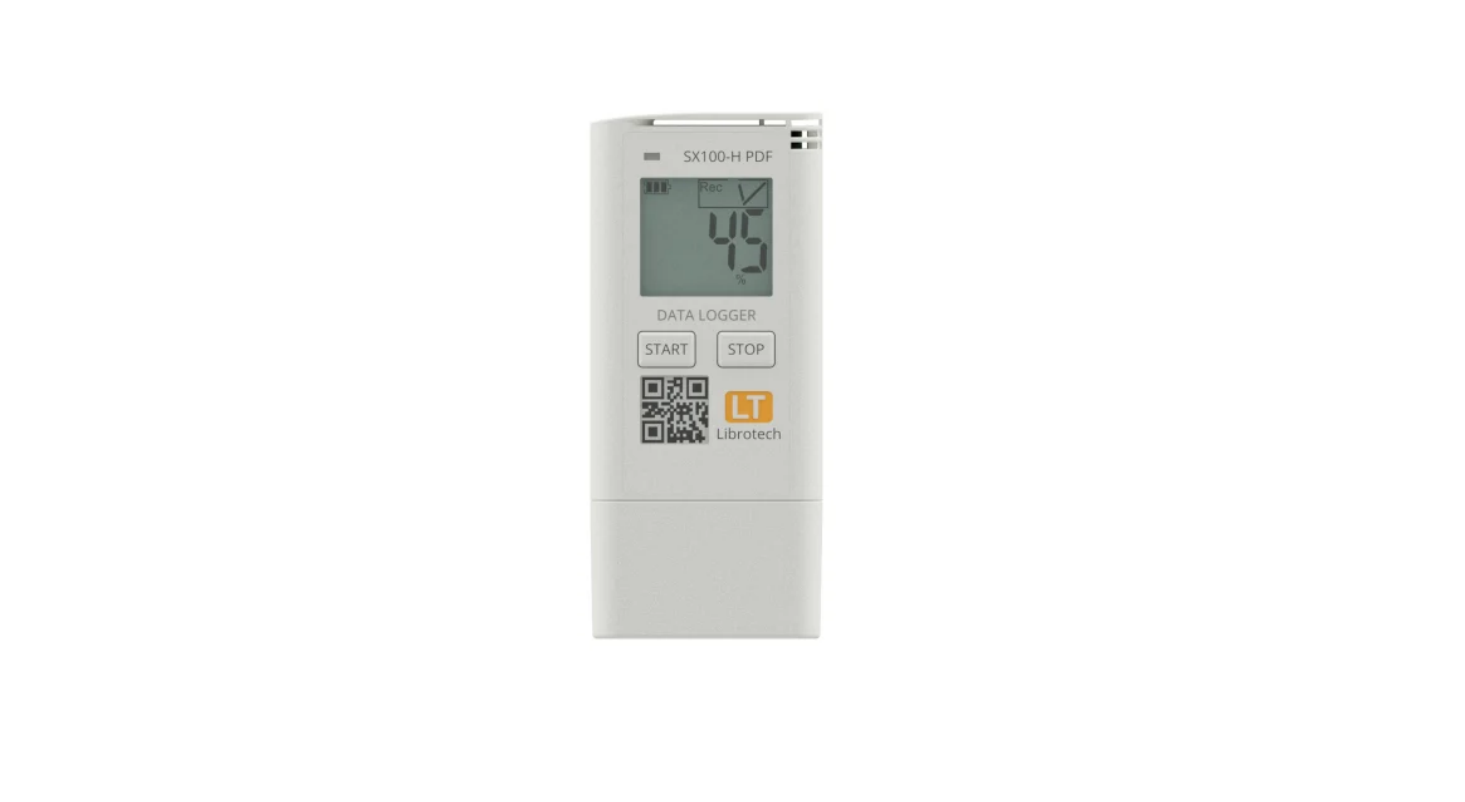
The data logger is a IoT device that is used to record environment parameters (such as temperature, humidity, pressure) and promptly alert if any of the monitored parameters exceeds the acceptable values. For example, loggers are used in the transportation of vaccines, because a slight deviation from the required temperature can spoil vaccines. You can keep a log of temperature from many storage points, analyze it on an online service, and receive alerts. Loggers don’t just collect information, but can also detect a trend for a decrease in temperature, so if someone forgets to close the refrigerator, the alarm will work in time.

One way to collect data is by connecting logger directly to the computer’s USB port. We can import text file, and it will look something like this:
| Date/time | Temperature | Humidity | ||
|---|---|---|---|---|
| 14:53:20 15.09.2021 | 23 | 45 | ||
| 14:53:20 15.09.2021 | 23 | 44 | ||
| 14:53:21 15.09.2021 | 23 | 44 | ||
| .. | .. | .. |
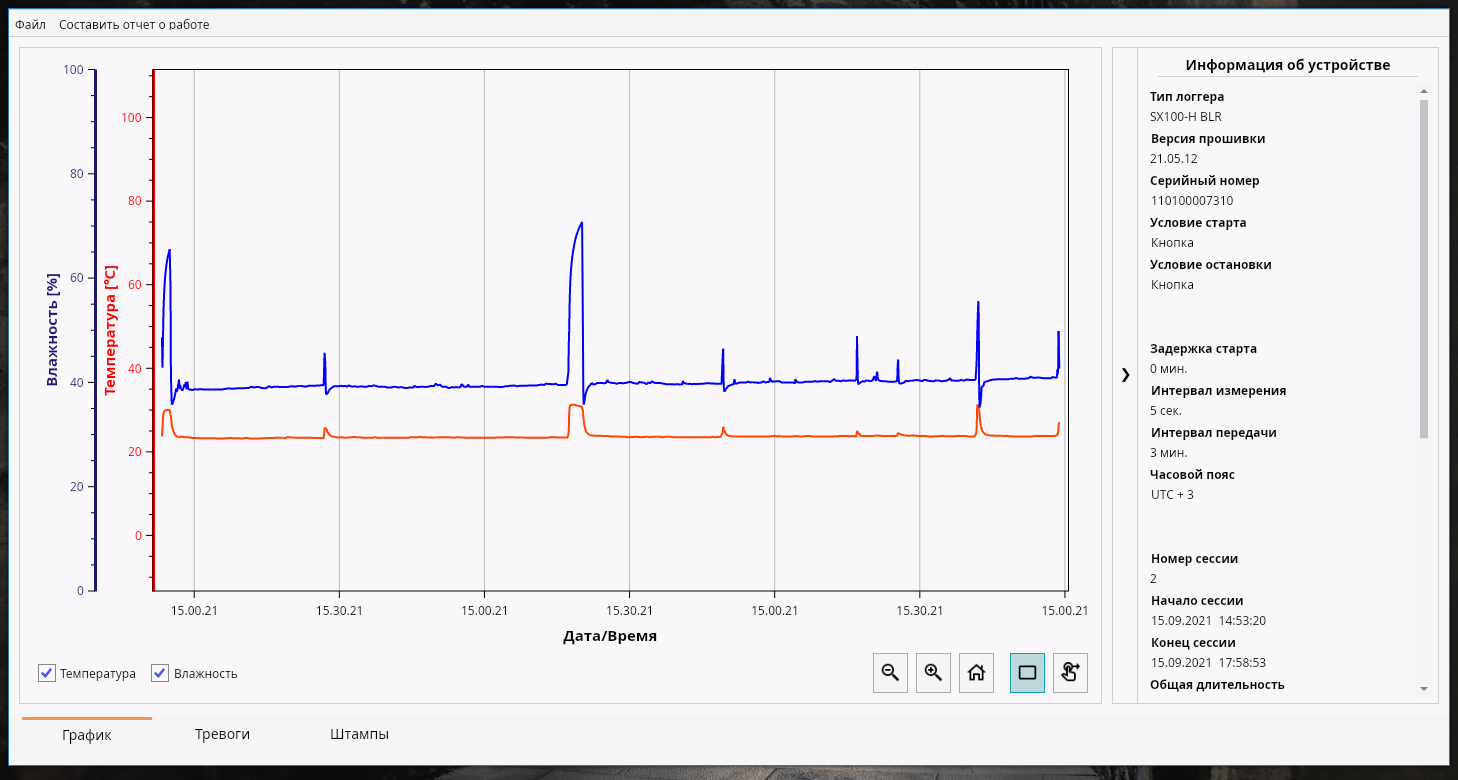
It is not convenient to analyze at all.A person may want to analyze data by viewing graphs and diagrams, zooming in and out, marking different places on the graph and adding notes to a text. The Librotech Inspection application is an offline solution for easy analysis of temperature, humidity and pressure values collected by the logger. You can also view the logger configuration, values range and save the charts as a .png file.

Implementation
When choosing technology to use for creating a desktop application, I considered the need for an enterprise solution where speed and reliability are the most important factors.
I was familiar with .NET, and it has high speed of development (compared to C++ for example), while at the same time having more performance compared to web-based solutions. Therefore I decided that it is a good choice for this project.
Regarding GUI, I wanted to use framework that supports modern .NET features, such as trimming, which greatly reduces the size of the final executable. After some research, I found Avalonia framework. It has following advantages:
- Active development, with focus on enterprise
- Cross-platform
- Supports new .NET versions
- Open-source
- Great charting tools
- Good performance and memory management
- ReactiveUI as model-view-viewmodel framework
Interface
I made an effort to make the interface as responsive and fast as possible. I reduced the load on the main thread by using asynchronous programming, and caching large amounts of data. I also wanted to write clean and testable code, so I properly followed the MVVM pattern combined with functional-reactive programming, which was made possible with the ReactiveUI framework.
One of the important ideas in creating a responsive and modern interface, is the concept of reactive programming. Reactive programming is actively used in almost all modern front-end frameworks, such as Vue, React and Angular. Actually, it’s really easy to describe it by using spreadsheets as an example. The value of the cell, in which the formula is written, depends on the values of all other cells that appear in the formula. And the value of the cell with the formula, changes every time when one of the formula’s parameters changes. Using my application as next example, the availability of tabs and pages changes depending on the uploaded file. So, if the file did not record temperature stamps, then page for them will not be displayed.
Application is multi-page, with navigation system. I developed page caching system to keep hided pages from taking up RAM, but at the same time retain their state. The IViewModelCache service is responsible for caching, it saves the ViewModel as a .json file, and stores a link to this file in RAM. When the ViewModel is needed, a new instance of ViewModel is created.
Plotting
The OxyPlot library is used for plotting. This is the most suitable component that I could find - fits into the MVVM concept, and shows good performance when rendering charts.
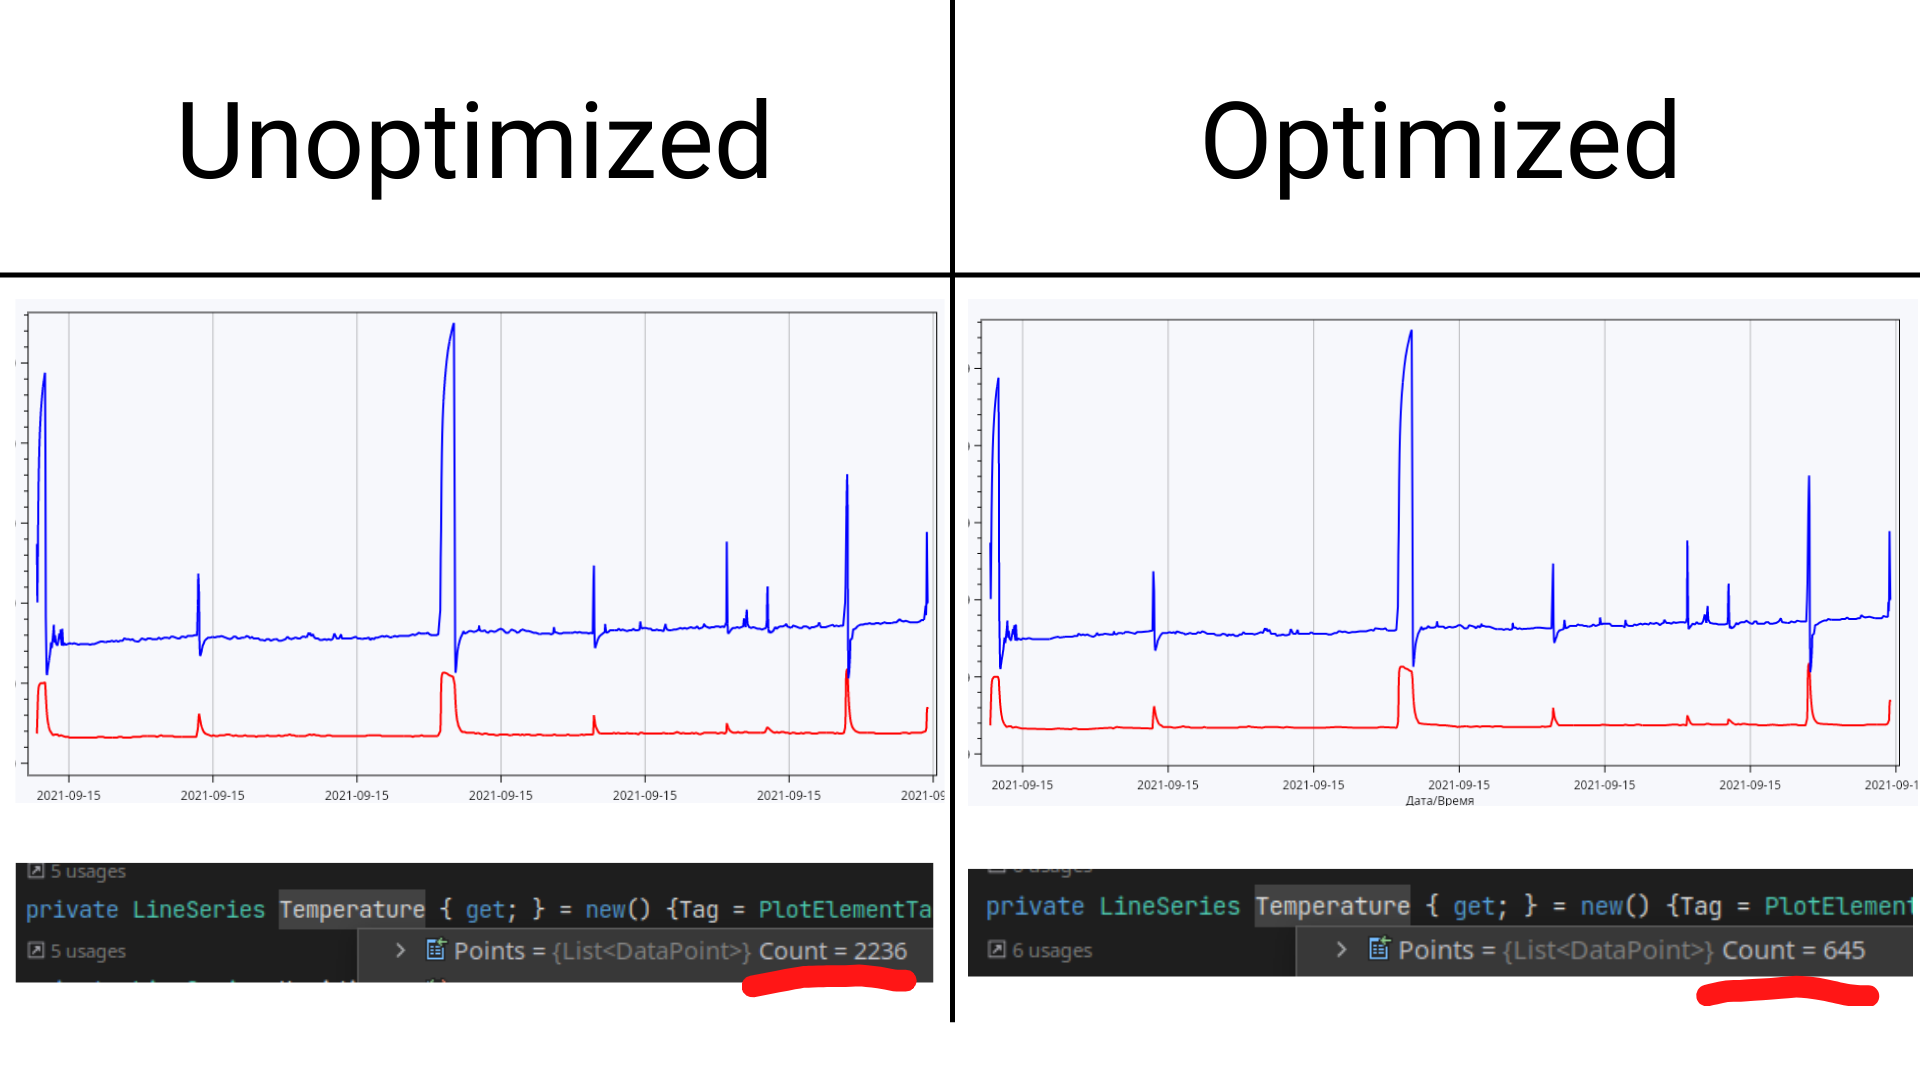
But I still had bad performance, for this reason I implemented the Ramer–Douglas–Peucker algorithm, to reduce the number of points needed to plot the graph. As a result, the number of points decreased by 360%, which had a good impact on performance. At the same time, the graph view has not changed, as you can see below -

Testing and logging
The are test written. The testing framework is xUnit, with FluentAssertions library added for better readability. One of the best decisions I made, was to introduce proper logging by NLog. Now the user, when faced with an error, can create a report with logs and send it to the developer for troubleshooting.